Sunday 27 December 2009

Multi-Server Management with SQL Server 2008 R2

A key challenge for many medium to large businesses is the management of multiple database server instances across the organization. SQL Server has always had a pretty good story with regards to multi-server management through automated multi-server jobs, event forwarding, and the ability to manage multiple instances from a single administrative console. In SQL Server 2008, Microsoft introduced a new solution called Data Collector for gathering key server performance data and centralizing it in a management data warehouse; and in SQL Server 2008 R2, this technology underpins a new way to proactively manage server resources across the enterprise.

With SQL Server 2008 R2, database administrators can define a central utility control point (UCP) and then enroll SQL Server instances from across the organization to create a single, central dashboard view of server resource utilization based on policy settings that determine whether a particular resource is being over, under, or well utilized. So for example, a database administrator in an organization with multiple database servers can see at a glance whether or not overall storage and CPU resources across the entire organization are being utilized appropriately, and can drill-down into specific SQL Server instances where over or under utilization is occurring to identify where more resources are required (or where there is spare capacity).

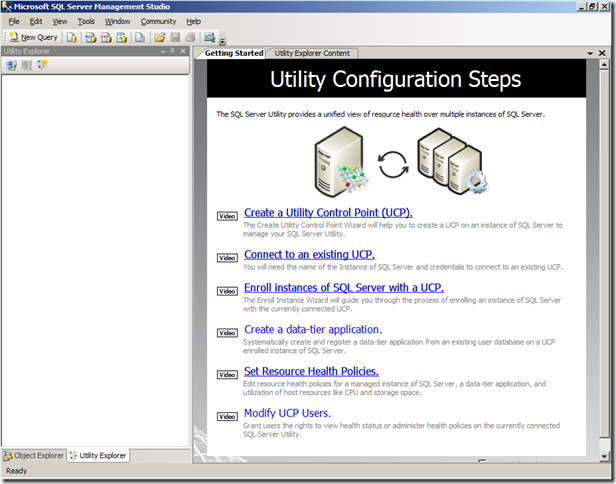
Sounds pretty powerful, right? So you’d expect it to be complicated to set up and configure. However, as I hope to show in this article, it’s actually pretty straightforward. In SQL Server Management Studio, there’s a new tab named Utility Explorer, and a Getting Started window that includes shortcuts to wizards that you can use to set up a UCP and enroll additional server instances.

Picture1

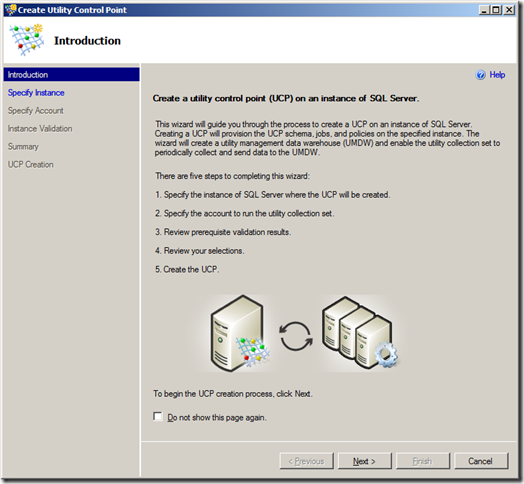
Clicking the Create a Utility Control Point link starts the following wizard:

Picture2

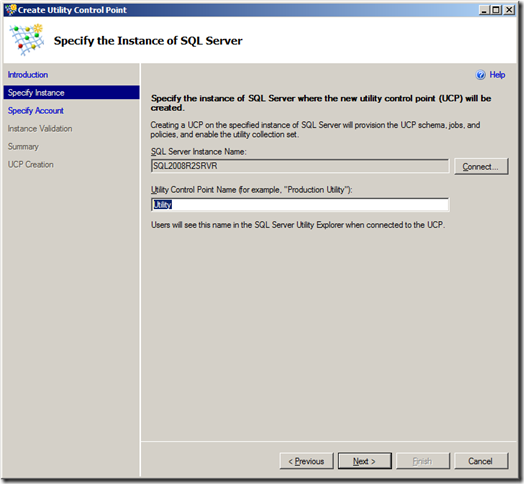
The first step is to specify the SQL Server instance that you want to designate as a UCP. This server instance will host the central system management data warehouse where the resource utilization and health data will be stored.

Picture3

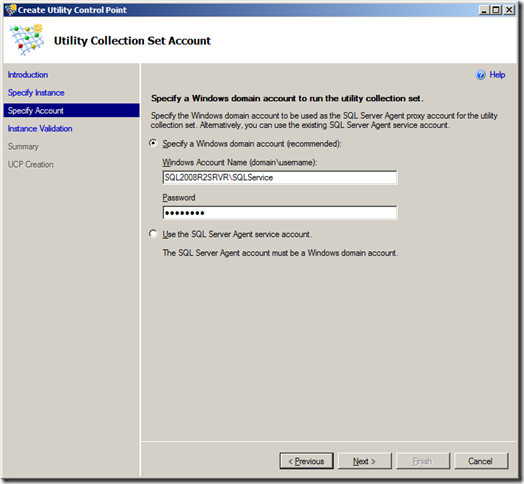
Next you need to specify the account that will be used to run the data collection process. This must be a domain account rather than a built-in system account (you can specify the account that the SQL Server Agent runs as, but again this must be a domain account).

Picture4

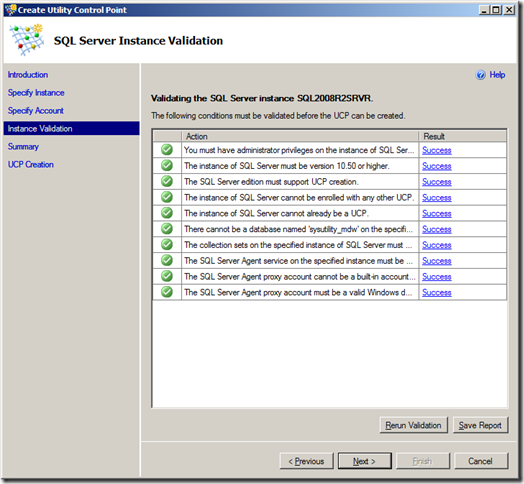
Now the wizard runs a number of verification checks as shown here:

Picture5

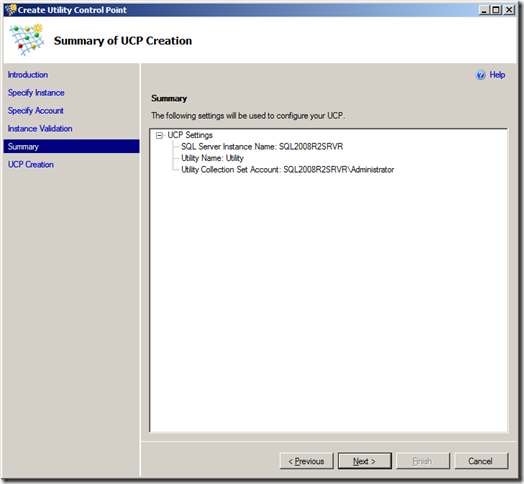
Assuming all of the verification checks succeed, you’re now ready to create the UCP.

Picture6

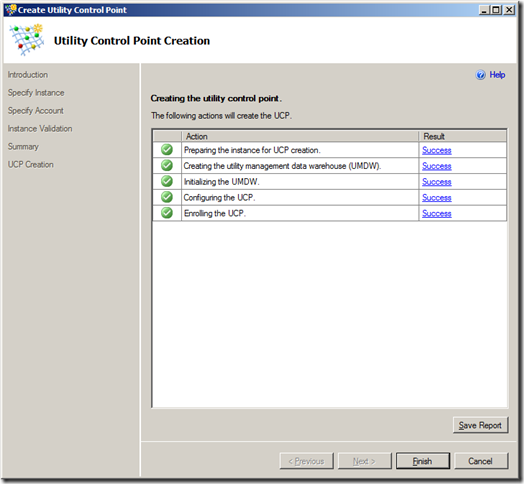
The wizard finally performs the tasks that are required to set up the UCP and create the management data warehouse.

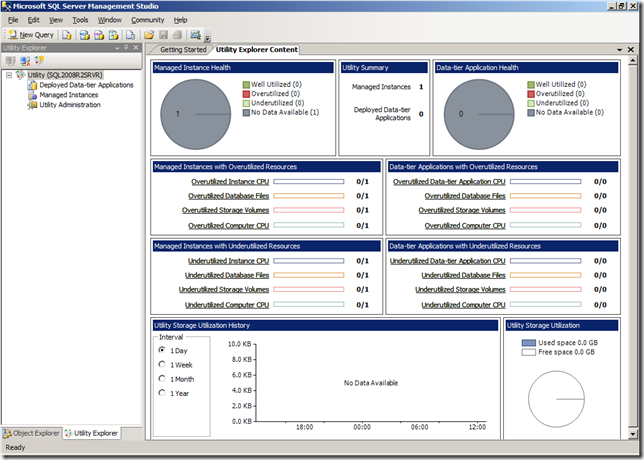
Picture7

After you’ve created the UCP, you can view the Utility Control Content window to see the overall health of all enrolled SQL Server instances. At this point, the only enrolled instance is the UCP instance itself, and unless you’ve waited for a considerable amount of time, there will be no data available. However, you can at least see the dashboard view and note that it shows the resource utilization levels for all managed instances and data-tier applications (another new concept in SQL Server 2008 R2 – think of them as the unit of deployment for a database application, including the database itself plus any server-level resources, such as logins, that it depends on).

Picture8

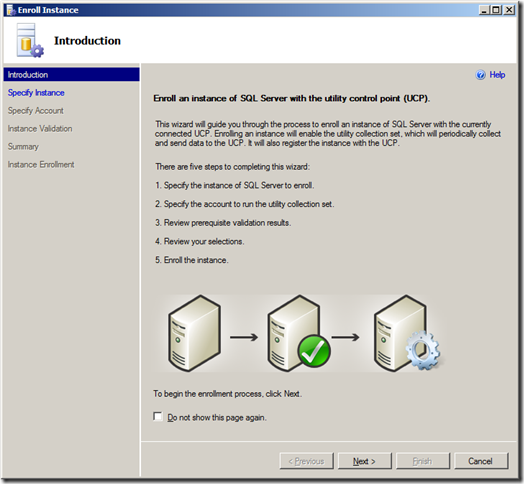
To enroll a SQL Server instance, you can go back to the Getting Started window and click Enroll Instances of SQL Server with a UCP. This starts the following wizard:

Picture9

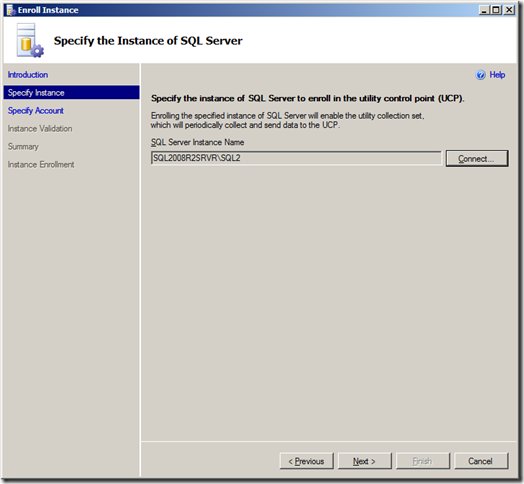
As before, the first step is the specify the instance you want to enroll. I’ve enrolled a named instance on the same physical server (actually, it’s a virtual server but that’s not really important!), but you can of course enroll any instance of SQL Server 2008 R2 in your organization (It’s quite likely that other versions of SQL Server will be supported in the final release, but in the November CTP only SQL Server 2008 R2 is supported).

Picture10

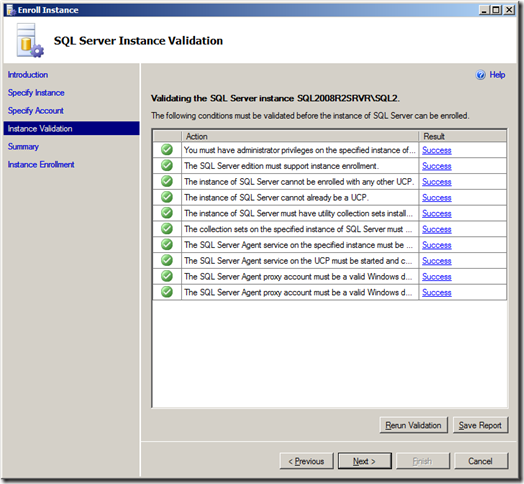
As before, the wizard performs a number of validation checks.

Picture11

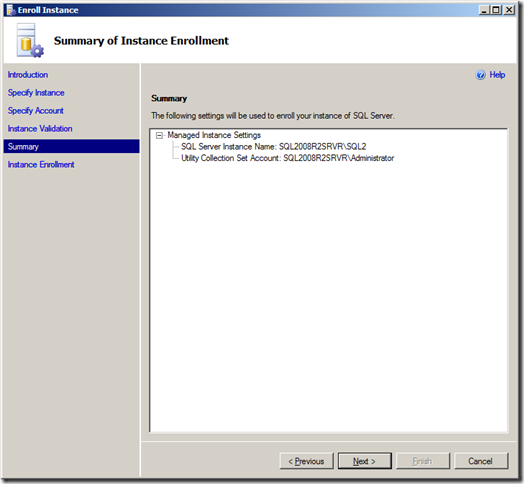
Then you’re ready to enroll the instance.

Picture12

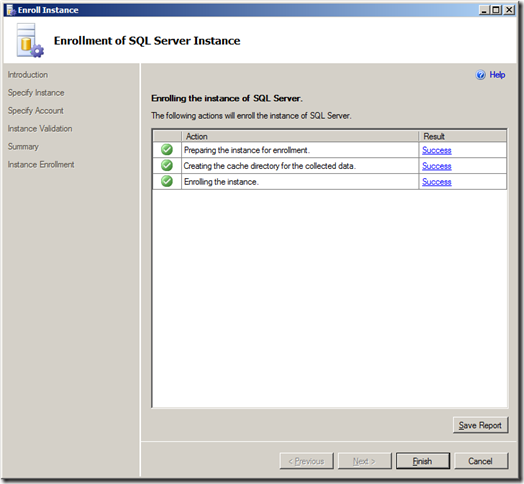
The wizard performs the necessary tasks, including setting up the collection set on the target instance.

Picture13

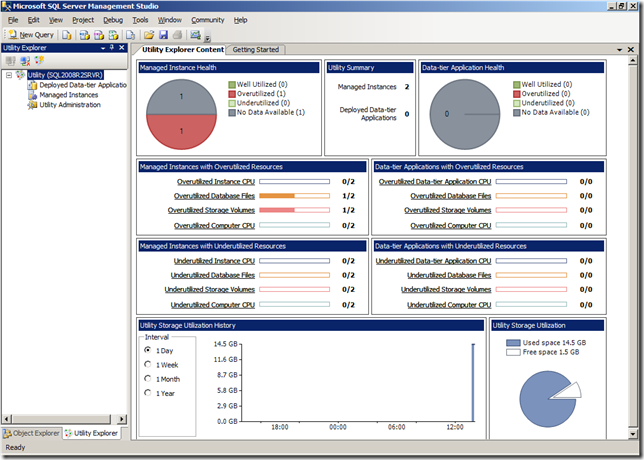
When you’ve enrolled all of the instances you want to manage, you can view the overall database server resource health from a single dashboard.

Picture14

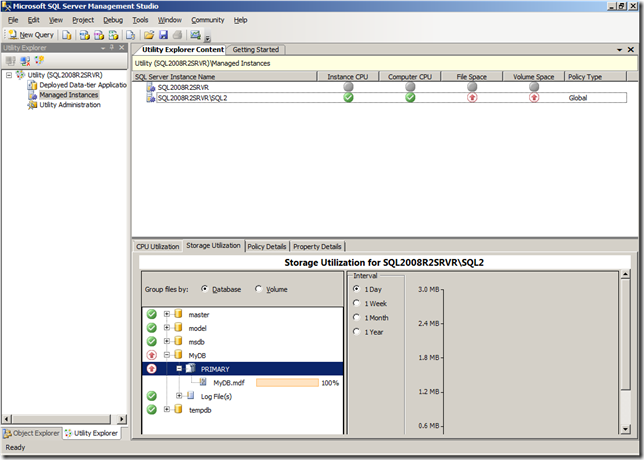
In this case, I have enrolled two server instances (the UCP itself plus one other instance) and I’ve deliberately filled a test database. Additionally, the virtual machine on which I installed these instances has a small amount of available disk space. As a result, you can see that there is some over-utilization of database files and storage volumes in my “datacenter”. To troubleshoot this overutilization, and find the source of the problem, I can click the Managed Instances node in the Utility Explorer window and select any instances that show over (or under) utilization to get a more detailed view.

Picture15

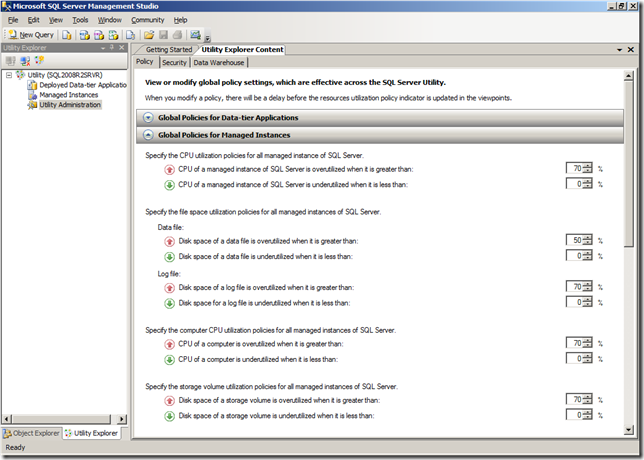
Of course, your definition of “over” or “under” utilized might differ from mine (or Microsoft’s!), you can configure the thresholds for the policies that are used to monitor resource utilization , along with how often the data is sampled and how many policy violations must occur in a specified period before the resource is reported as over/under utilized.

Picture16

These policy settings are global, and therefore apply to all managed instances. You can set individual policy settings to override the global polices for specific instances, though that does add to the administrative workload and should probably be considered the exception rather than the rule.

My experiment with utility control point-based multi-server management was conducted with the November community technology preview (CTP), and I did encounter the odd problem with collector sets failing to upload data. However, assuming these kinks are ironed out in the final release (or were caused by some basic configuration error of my own!), this looks to be the natural evolution of the data collector that was introduced in SQL Server 2008, and should ease the administrative workload for many database administrators.

Saturday 26 December 2009

Further Adventures in Spatial Data with SQL Server 2008 R2

Wow! Doesn’t time fly? In November last year I posted the first in a series of blog articles about spatial data in SQL Server 2008. Now here we are over a year later, and I’m working with the November CTP of SQL Server 2008 R2. R2 brings a wealth of enhancements and new features – particularly in the areas of multi-server manageability, data warehouse scalability, and self-service business intelligence. Among the new features that aren’t perhaps getting as much of the spotlight as they deserve, is the newly added support for including maps containing spatial data in SQL Server Reporting Services reports. This enables organizations that have taken advantage of the spatial data support in SQL Server 2008 to visualize that data in reports.

So, let’s take a look at a simple example of how you might create a report that includes spatial data in a map. I’ll base this example on the same Beanie Tracker application I created in the previous examples. To refresh your memory, this application tracks the voyages of a small stuffed bear named Beanie by storing photographs and geo-location data in a SQL Server 2008 database. You can download the script and supporting files you need to create and populate the database from here. The database includes the following two tables:

-- Create a table for photo records
CREATE TABLE Photos
([PhotoID] int IDENTITY PRIMARY KEY,
[Description] nvarchar(200),
[Photo] varbinary(max),
[Location] geography)
GO

-- Create a table to hold country data
CREATE TABLE Countries
(CountryID INT IDENTITY PRIMARY KEY,
CountryName nvarchar(255),
CountryShape geography)
GO

The data in the Photos table includes a Location field that stores the lat/long position where the photograph was taken as a geography point. The Countries table includes a CountryShape field that stores the outline of each country as a geography polygon. This enables me to use the following Transact-SQL query to retrieve the name, country shape, and number of times Beanie has had his photograph taken in each country:

SELECT CountryName,
CountryShape,
(SELECT COUNT(*)
FROM Photos p
WHERE (Location.STIntersects(c.CountryShape) = 1))
AS Visits
FROM Countries c

With the sample data in the database, this query produces the following results:

CountryName CountryShape Visits
France 0xE6100000 … (geography data in binary format) 1
Egypt 0xE6100000 … (geography data in binary format) 2
Kenya 0xE6100000 … (geography data in binary format) 1
Italy 0xE6100000 … (geography data in binary format) 2
United States of America 0xE6100000 … (geography data in binary format) 7
United Kingdom 0xE6100000 … (geography data in binary format) 2

To display the results of this query graphically on a map, you can use SQL Server Business intelligence Development Studio or the new Report Builder 3.0 application that ships with SQL Server 2008 R2 Reporting Services. I’ll use Report Builder 3.0, which you can install by using Internet Explorer to browse to the Report Manager interface for the SQL Server 2008 R2 Reporting Services instance where you want to create the report (typically http://<servername>/reports) and clicking the Report Builder button.

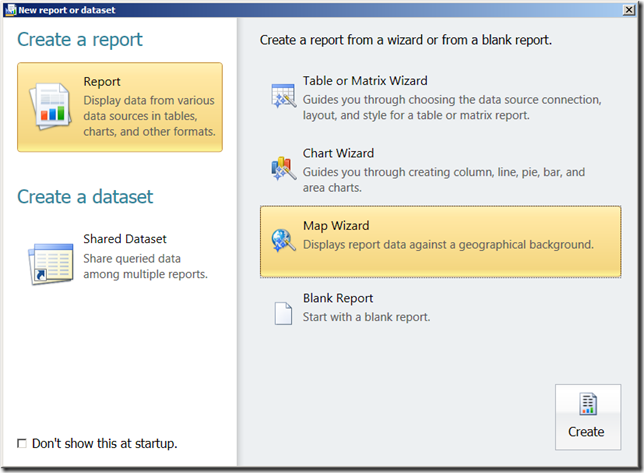
When you first start Report Builder 3.0, the new report or dataset page is displayed as shown below (if not, you can start it by clicking New on the Report Builder’s main menu).

Picture1

This page includes an option for the Map Wizard, which provides an easy way to create a report that includes geographic data. To start the wizard, select the Map Wizard option and click Create. This opens the following page:

Picture2

SQL Server 2008 R2 Reporting Services comes with a pre-populated gallery of maps that you can use in your reports. Alternatively, you can import an Environmental Systems Research Institute (ESRI) shapefile, or you can so what I’m doing and use a query that returns spatial data from a SQL Server 2008 database.

After selecting SQL Server spatial query and clicking Next, you can choose an existing dataset or select the option to create a new one. Since I don’t have an existing dataset, I’ll select the option to Add a new dataset with SQL Server spatial data and click Next, and then create a new data source as shown here:

Picture4

On the next screen of the wizard, you can choose an existing table, view, or stored procedure as the source of your data, or you can click Edit as Text to enter your own Transact-SQL query as I’ve done here:

Picture5

The next page enables you to select the spatial data field that you want to display, and provides a preview of the resulting map that will be included in the report.

Picture6

Note that you can choose to embed the spatial data in the report, which increases the report size but ensures that the spatial map data is always available in the report. You can also add a Bing Maps layer, which enables you to “superimpose” your spatial and analytical data over Bing Maps tiles as shown here:

Picture7

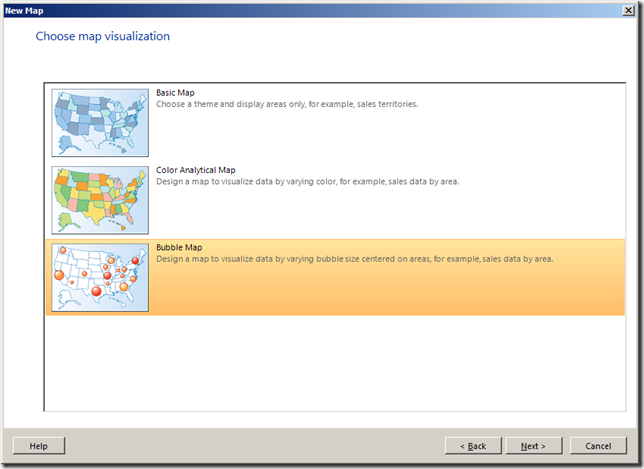
Next you can choose the type of map visualization you want to display. These include:

  • Basic Map: A simple visual map that shows geographical areas, lines, and points.
  • Color Analytical Map: a map in which different colors are used to indicate analytical data values (for example, you could use a color range to show sales by region in which more intense colors indicate higher sales)
  • Bubble Map: A map in which the center point of each geographic object is shown as a bubble, the size or color of which indicates an analytical value.

Picture8

To show the number of times Beanie has visited a country, I’m using a bubble map. Since the bubbles must be based on a data value, I must now choose the dataset that contains the values that determine the size of the bubbles.

Picture9

Having chosen the dataset, I now get a confirm or chance to change the default matches that the wizard has detected.

Picture10

Finally, you can choose a visual theme for the map and specify which analytical fields determine bubble size and the fill colors used for the spatial objects.

Picture11

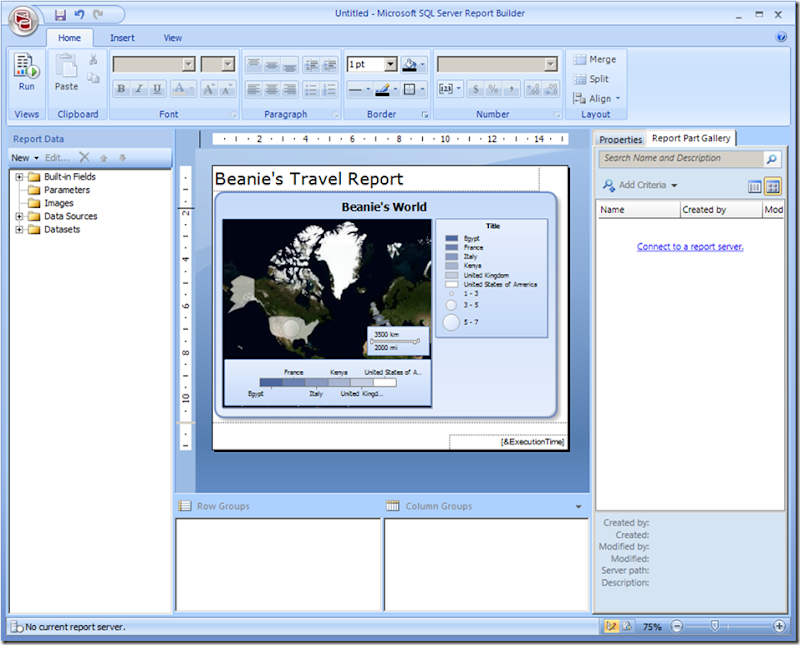
Clicking Finish, generates the report, which you can make further changes to with Report Builder.

Picture12

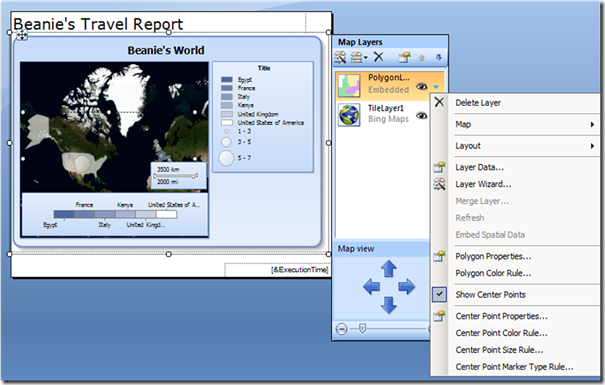
Selecting the map reveals a floating window that you can use to edit the map layers or move the area of the map that is visible in the map viewport (the rectangle in which the map is displayed).

Picture13

You can make changes to the way the map and its analytical data are displayed by selecting the various options on the layer menus. For example, you can:

  • Click Polygon Properties to specify a data value to be displayed as a tooltip for the spatial shapes on the map.
  • Click Polygon Color Rule to change the rule used to determine the fill colors of the spatial shapes on the map.
  • Click Center Point Properties to add labels to each center point “bubble” on the map.
  • Click Center Point Color Rule to change the rule used to determine the color of the bubbles, including the scale of colors to use and how the values are distributed within that scale.
  • Click Center Point Size Rule to change the rule used to determine the size of the bubbles, including the scale of sizes to use and how the values are distributed within that scale.
  • Click Center Point Marker Type Rule to change the rule used to determine the shape or image of the bubbles, including a range of shapes or images to use and how the values are matched to shapes or images in that range.

At any time, you can preview the report in Report builder by clicking Run. Here’s how my report looks when previewed.

Picture14

When you’re ready to publish the report to the report server, click Save on the main menu, and then click Recent Sites and Servers in the Save As Report dialog box to save the report to an appropriate folder on the report server.

Picture15

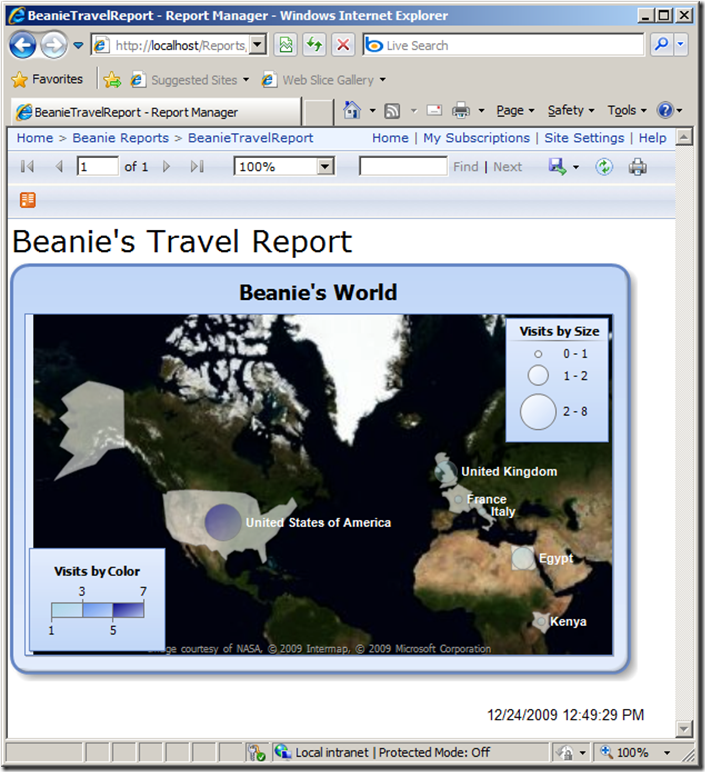
After the report has been published, users can view it in their Web browser through the Report manager interface. here’s my published report:

Picture16

I’ve only scratched the surface of what’s possible with the map visualization feature in SQL Server 2008 R2 Reporting Services. When combined with the spatial data support in SQL Server 2008 it really does provide a powerful way to deliver geographical analytics to business users, and hopefully you’ve seen from this article that it’s pretty easy to get up and running with spatial reporting.